> For the complete documentation index, see [llms.txt](https://docs.quadratichq.com/llms.txt). Markdown versions of documentation pages are available by appending `.md` to page URLs; this page is available as [Markdown](https://docs.quadratichq.com/spreadsheet/present-and-share.md).
# Present & share
## Present & share
1. [Present your data directly:](#present-your-data) make your spreadsheet more viewable while not editing.
2. [Visualize your data:](#visualize-your-data) turn raw data into beautiful visualizations.
3. [Share your work:](#share-your-work) let others play with and edit your work as a team.
4. [Copy as PNG:](#copy-as-png) copy and paste data into any presentation, design tool, or anywhere else you'd want to share your PNG.
5. [Export your file:](#export-your-file) download your work as Excel, CSV, or a Quadratic file.
6. [Embed as an iFrame:](#embed-in-a-webpage-via-iframe) get your spreadsheets into any page on the web.
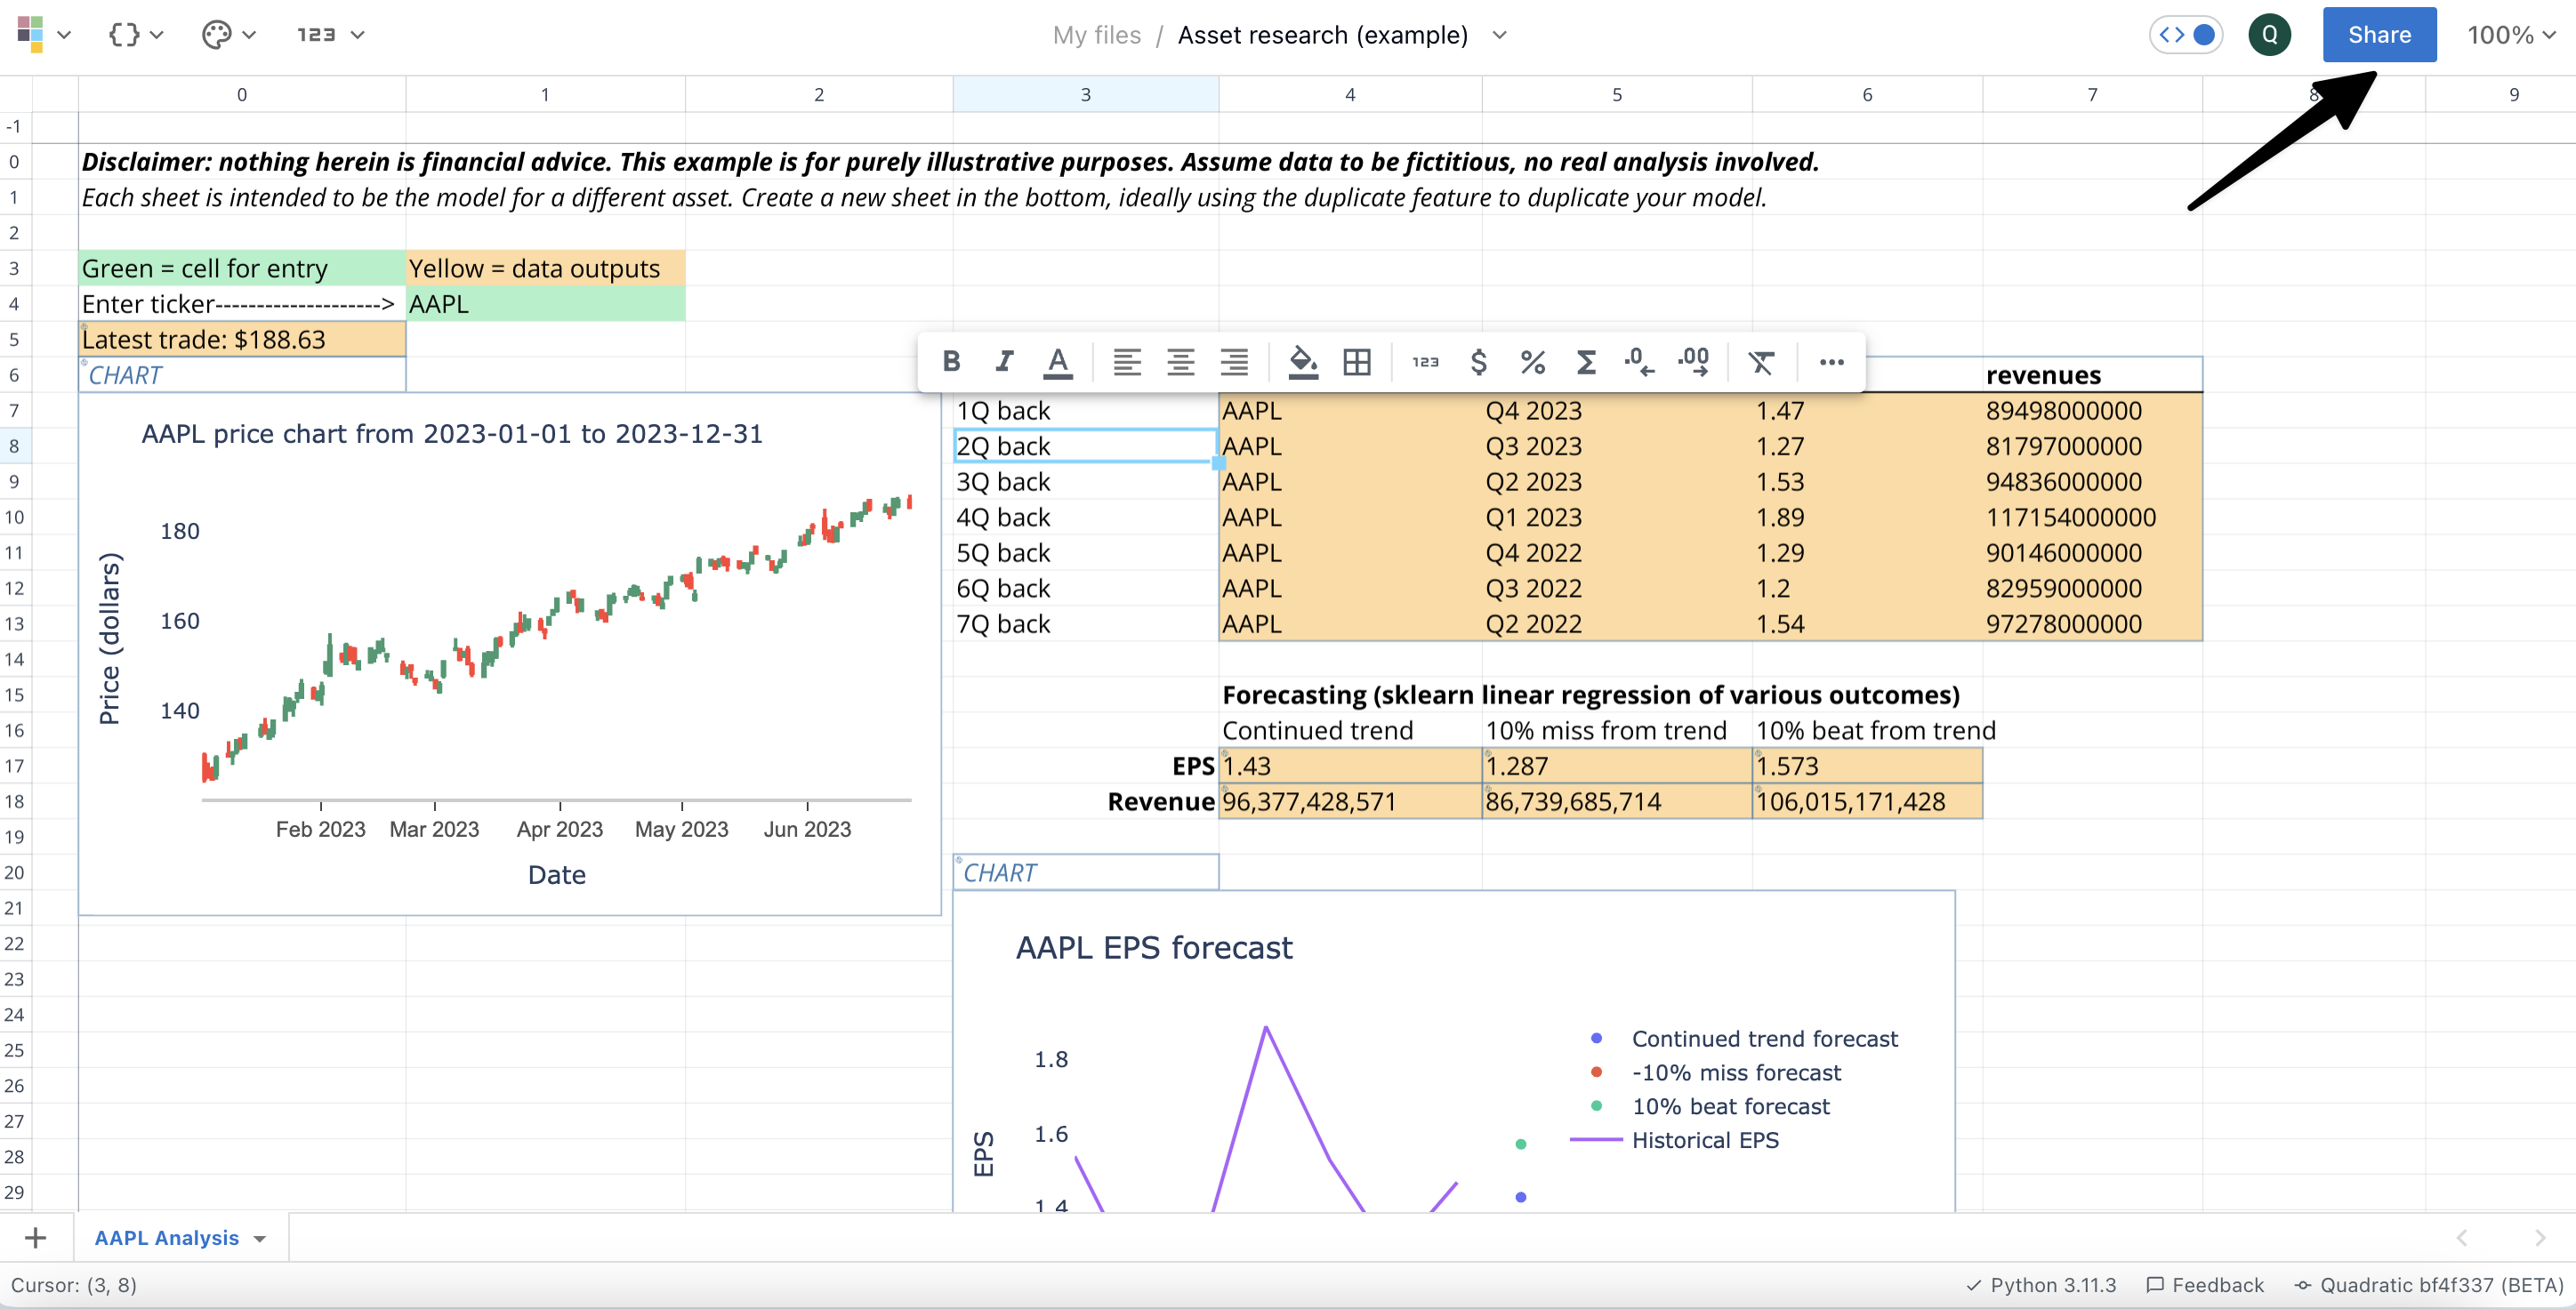
### 1. Present your data
`Ctrl` + `.` (Mac: `⌘ Command` + `.`) enters presentation mode, removing the grid lines to present your data and visualizations, seamlessly.
Notice how the grid and toolbars disappear in presentation mode, enabling a smooth presentation mode. We recommend using `Spacebar` + `Mouse` to smoothly pan as you present your workbooks.
### 2. Visualize your data
Create beautiful Plotly charts in Quadratic. View the visualize your data page to learn more.
📊Learn how to: Create visualizations in Quadratic ->
### 3. Share your work
By sharing, you allow other users to view your sheet, code, etc.
Files shared publicly can be viewed by anyone with the link — viewers without edit access see a read-only sheet.
### 4. Copy as PNG
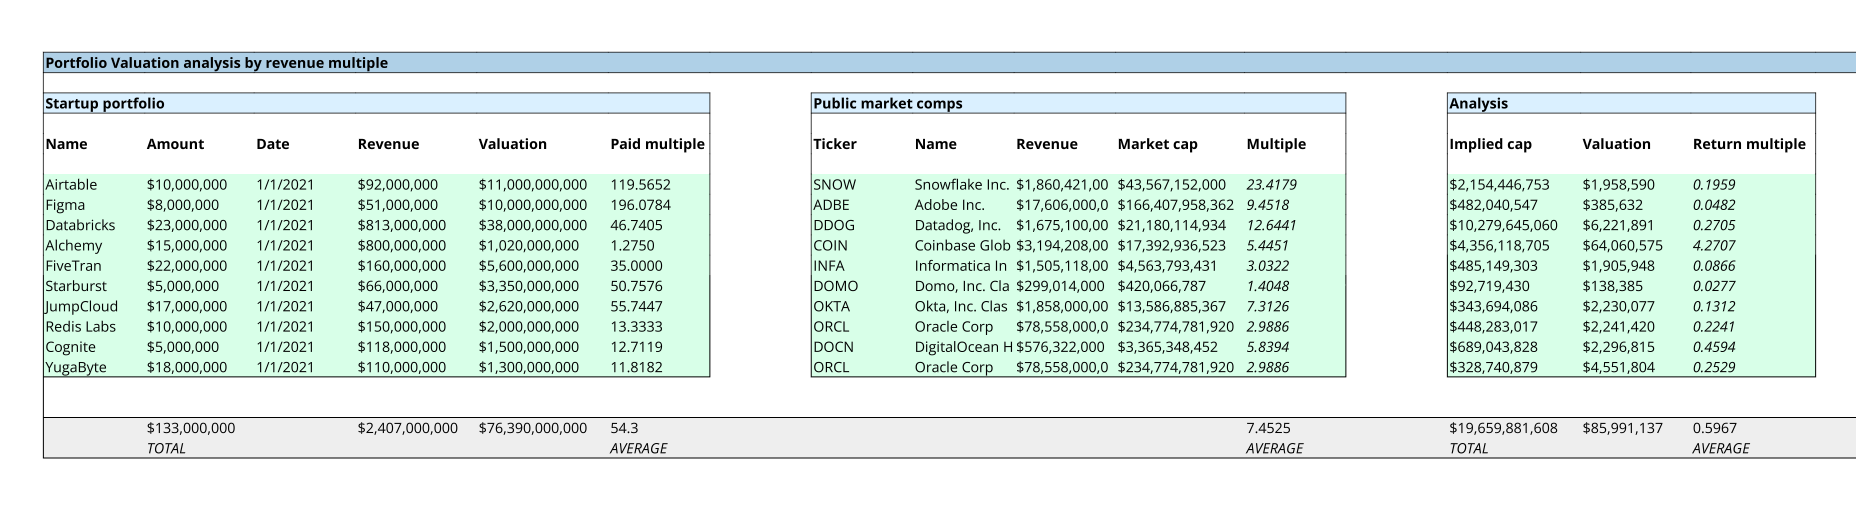
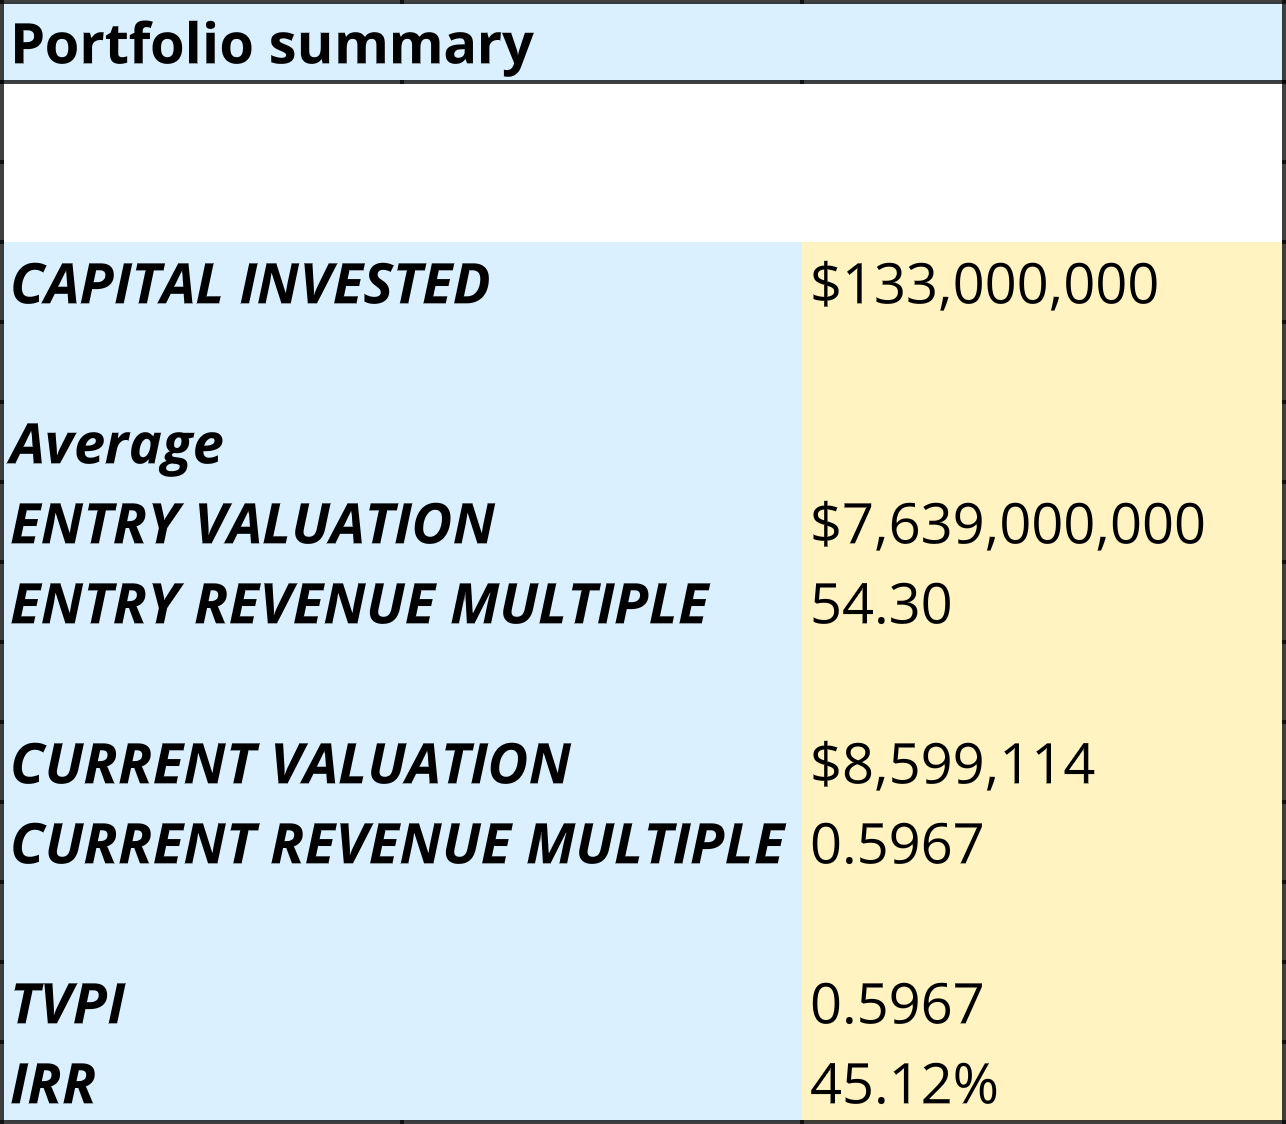
Select the cells you wish to copy and simply `Right-click` and select copy as PNG or use the shortcut `Ctrl` + `Shift` + `c` (Mac: `⌘ Command` + `Shift` + `c`). You can also download a selection as a `.png` file.
You can then paste your PNG into your presentations, articles, etc.
Note: the below sample data has used the copy-paste as PNG feature to copy/paste straight into our docs!
### 5. Export your file
Export from **File > Download**:
| Format | Scope |
| ----------------- | ------------------------- |
| Excel (.xlsx) | Whole file |
| CSV | Current sheet |
| Quadratic (.grid) | Whole file, native format |
| PNG | Current selection |
{% hint style="info" %}
File exports (Excel, CSV, .grid) are included in paid plans — see Plans & billing.
{% endhint %}
### 6. Embed in a webpage via iFrame
If you have public sharing permissions turned ON in your spreadsheet, you can freely embed your spreadsheet in any site that allows embedding. Use the URL to your spreadsheet in an `
```
---
# Agent Instructions
This documentation is published with GitBook. GitBook is the documentation platform designed so that both humans and AI agents can read, navigate, and reason over technical content effectively. Learn more at gitbook.com.
## Querying This Documentation
If you need additional information that is not directly available in this page, you can query the documentation dynamically by asking a question.
Perform an HTTP GET request on the current page URL with the `ask` query parameter, and the optional `goal` query parameter:
```
GET https://docs.quadratichq.com/spreadsheet/present-and-share.md?ask=&goal=
```
`ask` is the immediate question: it should be specific, self-contained, and written in natural language.
`goal` is optional and describes the broader end goal you are ultimately trying to accomplish on behalf of the user. GitBook uses it to tailor the answer towards what is most useful for that goal.
The response will contain a direct answer to the question and relevant excerpts and sources from the documentation.
Use this mechanism when the answer is not explicitly present in the current page, you need clarification or additional context, or you want to retrieve related documentation sections.